Table of Contents
While the RMS meter mode helps to better reflect on how we hear the volume of sound, it isn’t without limitations. RMS meters react visually the same way to any frequencies that pass through it. An RMS meter doesn’t distinguish between a high frequency sound or a low frequency sound, unlike human beings who have different sensitivities to sound at varying frequencies. For example, we perceive changes in mid-range frequencies much more acutely than volume changes at lower frequencies. To account for this, an entirely new metering scale has been created to specifically account for how human beings perceive loudness. The scale is called LUFS: Loudness Units Full Scale. LUFS is a refinement of the scale called LKFS. Today, the terms LUFS and LKFS can be used interchangeably.
The LUFS scale is used extensively in the broadcast television industry. To help ensure consistent volumes as you switch between channels, there are government standards that mandate programs adhere to an average LUFS level over the course of the program. Using the LUFS scale as a reference for understanding volume has spilled over to web delivery and even video games. It’s very possible that a game company might request that the mix for a music track fall within a defined average LUFS level in order to make things more predictable in terms of how the music will balance with the rest of the sounds in the game.
The meters in the Mixing Desk do not have the LUFS option, but Wwise does provide a specific LUFS Loudness meter with four Sync Groups that can be assigned to objects in the Master-Mixer Hierarchy in a way similar to what you did with the Meter view in the last exercise. By default, Sync Group 1 for the Loudness Meter is assigned to the Master Audio Bus, so you’ll assign Sync Group 2 to the Wwise 201 Music Audio Bus.
-
In the main menu, choose Views > Loudness Meter > Loudness Meter - Sync Group 2.
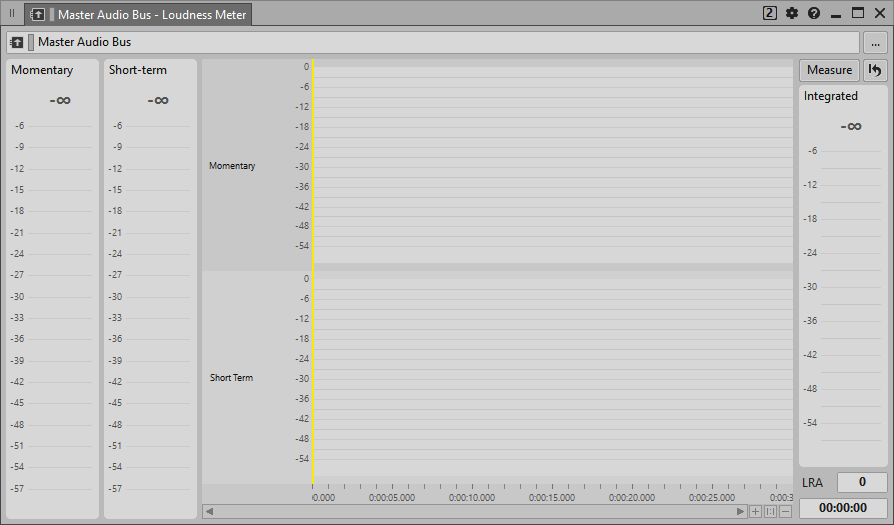
The Loudness Meter is displayed, but it’s assigned by default to the Master Audio Bus.
-
Assign the Loudness Meter to the Wwise 201 Music Bus.

-
Play the music to see how the Loudness Meter responds.

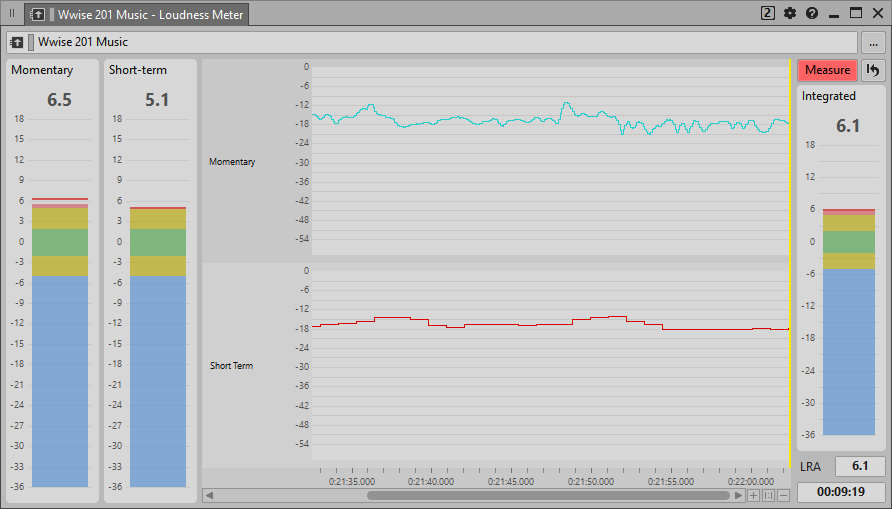
You can see how the Short-term meter reacts more slowly than the Momentary meter. This is because the Momentary meter reacts quickly averaging the perceived loudness over 0.4 seconds while the Short-term meter averages over the last 3 seconds.
The larger Integrated section of the meter isn’t displaying anything. The Integrated measurement is used to understand loudness over long periods of time, but it isn’t activated until you click the Measure button. Also, levels that drop below -70 LUFS are not factored into the Integrated meter’s average. This lets you stop and start your music without having to have the silence impact the Integrated meter’s reading.
-
Click Measure and continue to play the music.

The integrated meter will continue to average the loudness until the Reset button is pressed. This is helpful to get a feel for the overall loudness of a song segment like the Combat music when played for a long period of time. You could then reset this meter and see how that compares to the Explore music played for a long time as well. It’s reasonable to say that you want the Combat music to be perceived as louder, but how much louder is something that’s hard to put into numbers and compare using conventional metering.
You’ll also see a value in the lower-right corner called LRA, which represents Loudness Range. Loudness Range is a calculation of the material's dynamic range expressed in LU–Loudness Units. It helps you understand how much perceived loudness change there is between the softer and louder sections of the audio. This display is also tied to the Integrated meter so it’s only displayed when capturing. Music that has a large LRA can sometimes be a challenge when heard in the context of gameplay, as it’s sometimes difficult to find a music volume where the louder sections can be heard appropriately with the sound effects without the quieter sections being completely drowned out by the other audio occurring during gameplay. You’ll learn in the next exercise some approaches to managing this problem.
It's also possible to show the Momentary and Short-term meter values graphed over time in the center section of the Loudness Meter. To do this you need start a capture session.
-
Click Capture and continue to play the music.

You now see the Momentary and Short-term values display over time. This can make it much easier to review levels over long periods of time without having to constantly watch the real-time meters.
You’ve no doubt noticed that segments of the various Loudness Meter meters appear blue, yellow, or green. The green area is referred to as the target zone, or the “ideal” loudness level. In broadcasting, the target for the average level over the course of a television show is around -23 to -24 LUFS depending on the governing agency. For web delivered content, that target is commonly set around -16 to -18 LUFS. In other words, the target could be different depending on the application. For video games, there is no one set standard, but a game company may have standards it uses internally and may even mandate that mixes be delivered at a defined target level. The target value can be adjusted by using the View Settings available for the Loudness Meter.
-
Click the View Settings icon.

You see a variety of settings and you can see that the target is set to -23, the standard for European broadcast television. The target range values indicate how many dB above or below the Target Level it will take the meter to turn green—on target—or yellow—close to the target. You can leave the Target Level value at -23, but it can sometimes seem a bit awkward to try and think of a value like -23 as being on the mark. Instead, you can change the Unit scale from LUFS (Loudness Units Full Scale) to LU (Loudness Unit).
-
Change the Unit value to LU.

You can see that the point on the meter that was at -23 now shows a 0. This means that you’ve deviated 0 Loudness Units from the ideal target value, where the positive and negative values indicate how many LU you are away from the target value.
-
Close the window.
As you can see, this is a very useful meter. So useful that it’s a good idea to add it to the Mixer layout so you can always keep an eye on it.
-
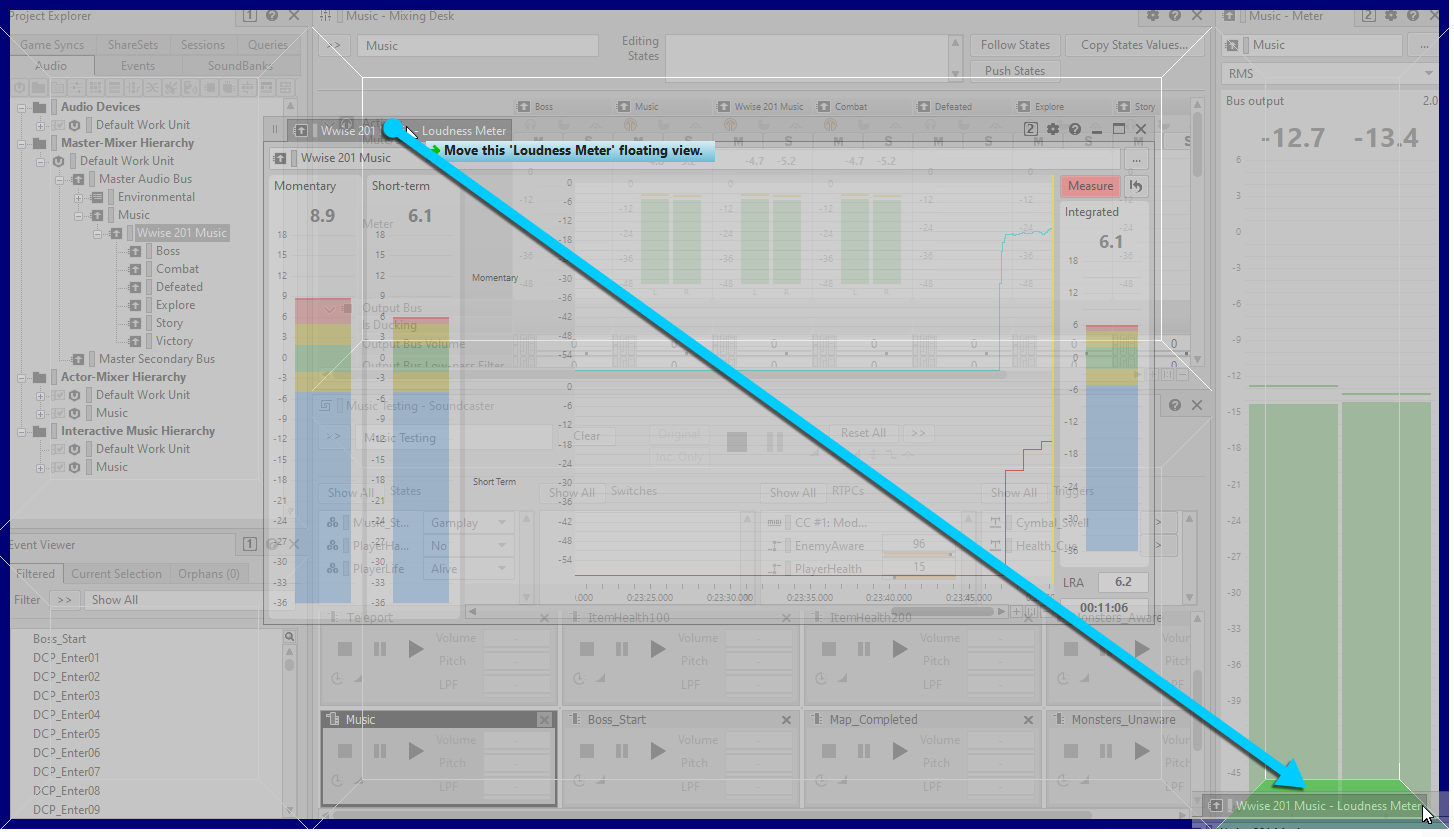
Drag the Loudness Meter tab to just beneath the Meter view.
You may be asked to confirm that you want to change the layout.
-
If asked to confirm that you want to change the layout, click the Yes button to confirm.

The Music Loudness Meter is docked to the bottom of the Master Audio Bus Meter. You can resize the view by dragging the border between the two meters.
-
Drag the top of the Loudness meter to make it larger.

Now you can simultaneously see Peak, RMS, and multiple Loudness Meters for the Wwise 201 Music Audio Bus. That’s a lot of visual feedback!
-
Deselect the Capture button and stop playback.