-
-
-
-
-
-
-
-
-
-
-
-
-
-
-
-
Glossary
-
-
-
-
-
-
Wwise's game profiling tools consist of three views which work together to help you analyze your project's performance in detail. These views have been combined into the Profiler layout.
![[Tip]](/images/2023.1.3_8471/?source=Help&id=tip.png) | Tip |
|---|---|
By default in Wwise, you can switch to the Profiler layout by pressing F6. |
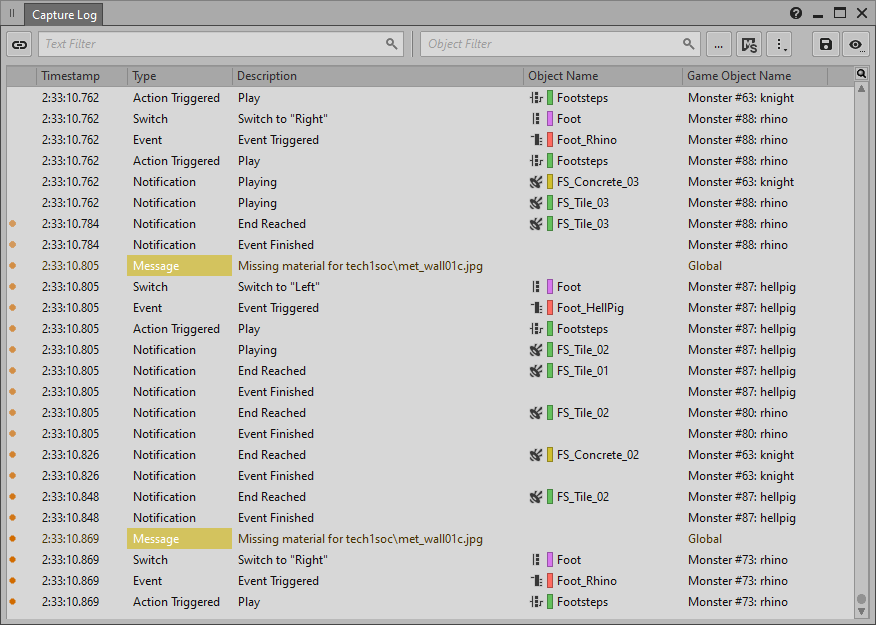
The Capture Log can capture and record all information coming from the sound engine. Using the Capture Log Options, you decide what captured information is displayed in the Capture Log. To limit which types of data are captured, adjust the Advanced Profiler's Profiler Settings.
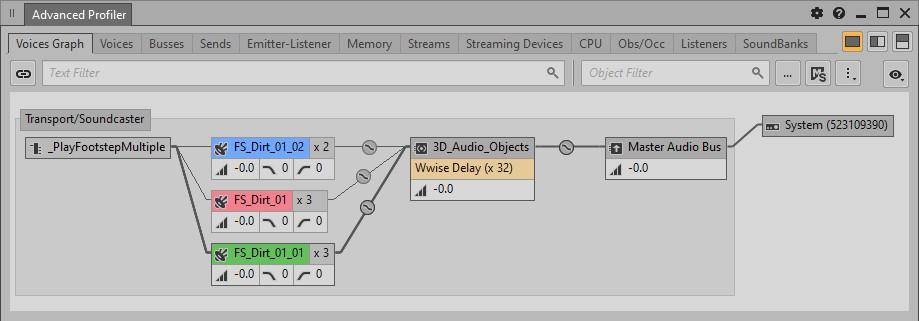
The Advanced Profiler contains performance-related information, such as CPU, memory, and bandwidth, for each activity performed by the sound engine. The information is displayed in real time as it is captured from the sound engine. You decide what types of information are displayed in the tabs of the Advanced Profiler in the Profiler Settings dialog.
![[Note]](/images/2023.1.3_8471/?source=Help&id=note.png) | Note |
|---|---|
Non-mixing busses are not displayed in the Voices Graph tab or Busses tab. Refer to Understanding the bus icons and processing status for more information on the various processing statuses. |
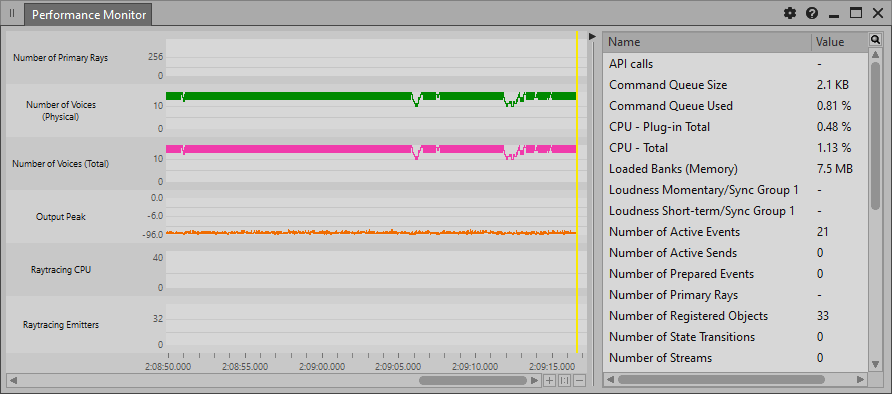
The Performance Monitor is a comprehensive set of sound engine metrics that can help you monitor performance and troubleshoot problems. You can configure the Performance Monitor to display only the information you require.
| Note |
|---|---|
As seen in the Number of Voices (Physical) and Number of Voices (Total) rows in the preceding image, a thick line at the top of the graph view range indicates a value above the Graph Max. |
Was this page helpful?
Need Support?
Questions? Problems? Need more info? Contact us, and we can help!
Visit our Support pageTell us about your project. We're here to help.
Register your project and we'll help you get started with no strings attached!
Get started with Wwise